Transforming Voyage Estimation into a High-Impact Daily Workflow Tool
OpenOcean STUDIO – A next-generation maritime platform designed to provide real-time actionable insights with a unified commercial and operational view. Trusted by ship owners, operators, and managers, it aims to streamline maritime operations with accurate voyage estimations and data-driven decision-making.
The existing Voyage Estimator tool lacked visibility and usability. It was outdated, with minimal adoption, and was a major reason for potential clients choosing competitor software that offered more modern, user-friendly estimation tools.
Client
Ninety Percent of Everything (90POE)
Areas
Maritime
Enterprise UX
Accessibility
Services Provided
Product Design, UX Research, Stakeholder Management, UX Strategy, Design Systems
Tools used
Figma, Jira, Heap Analytics, Miro

Summary
90POE aimed to build a comprehensive commercial management platform for maritime operations, and an improved Estimator tool was essential to achieving this goal. Without an effective estimator, the platform remained incomplete, and users resorted to third-party tools to fulfill their needs.
Research methods conducted
To inform design decisions with clarity and confidence, I employed a mixed-methods research approach. This included qualitative insights through direct user interviews, quantitative data from product analytics (Heap), and strategic market context via competitive benchmarking. Each method surfaced distinct patterns, helping prioritize user pain points, align with business goals, and identify opportunities for differentiation.
Key findings & Pain points
Through user research and data analysis, we surfaced both functional gaps and usability barriers affecting overall efficiency. Key findings revealed broken workflows, scattered interfaces, and unmet feature expectations. On the critical side, users struggled with dense navigation structures, overwhelming data presentation, and input processes that introduced avoidable friction. These insights directly shaped design priorities and informed system-level decisions.
💡 Key findings
🚨 Critical Pain Points Identified
Insights & Project alignement
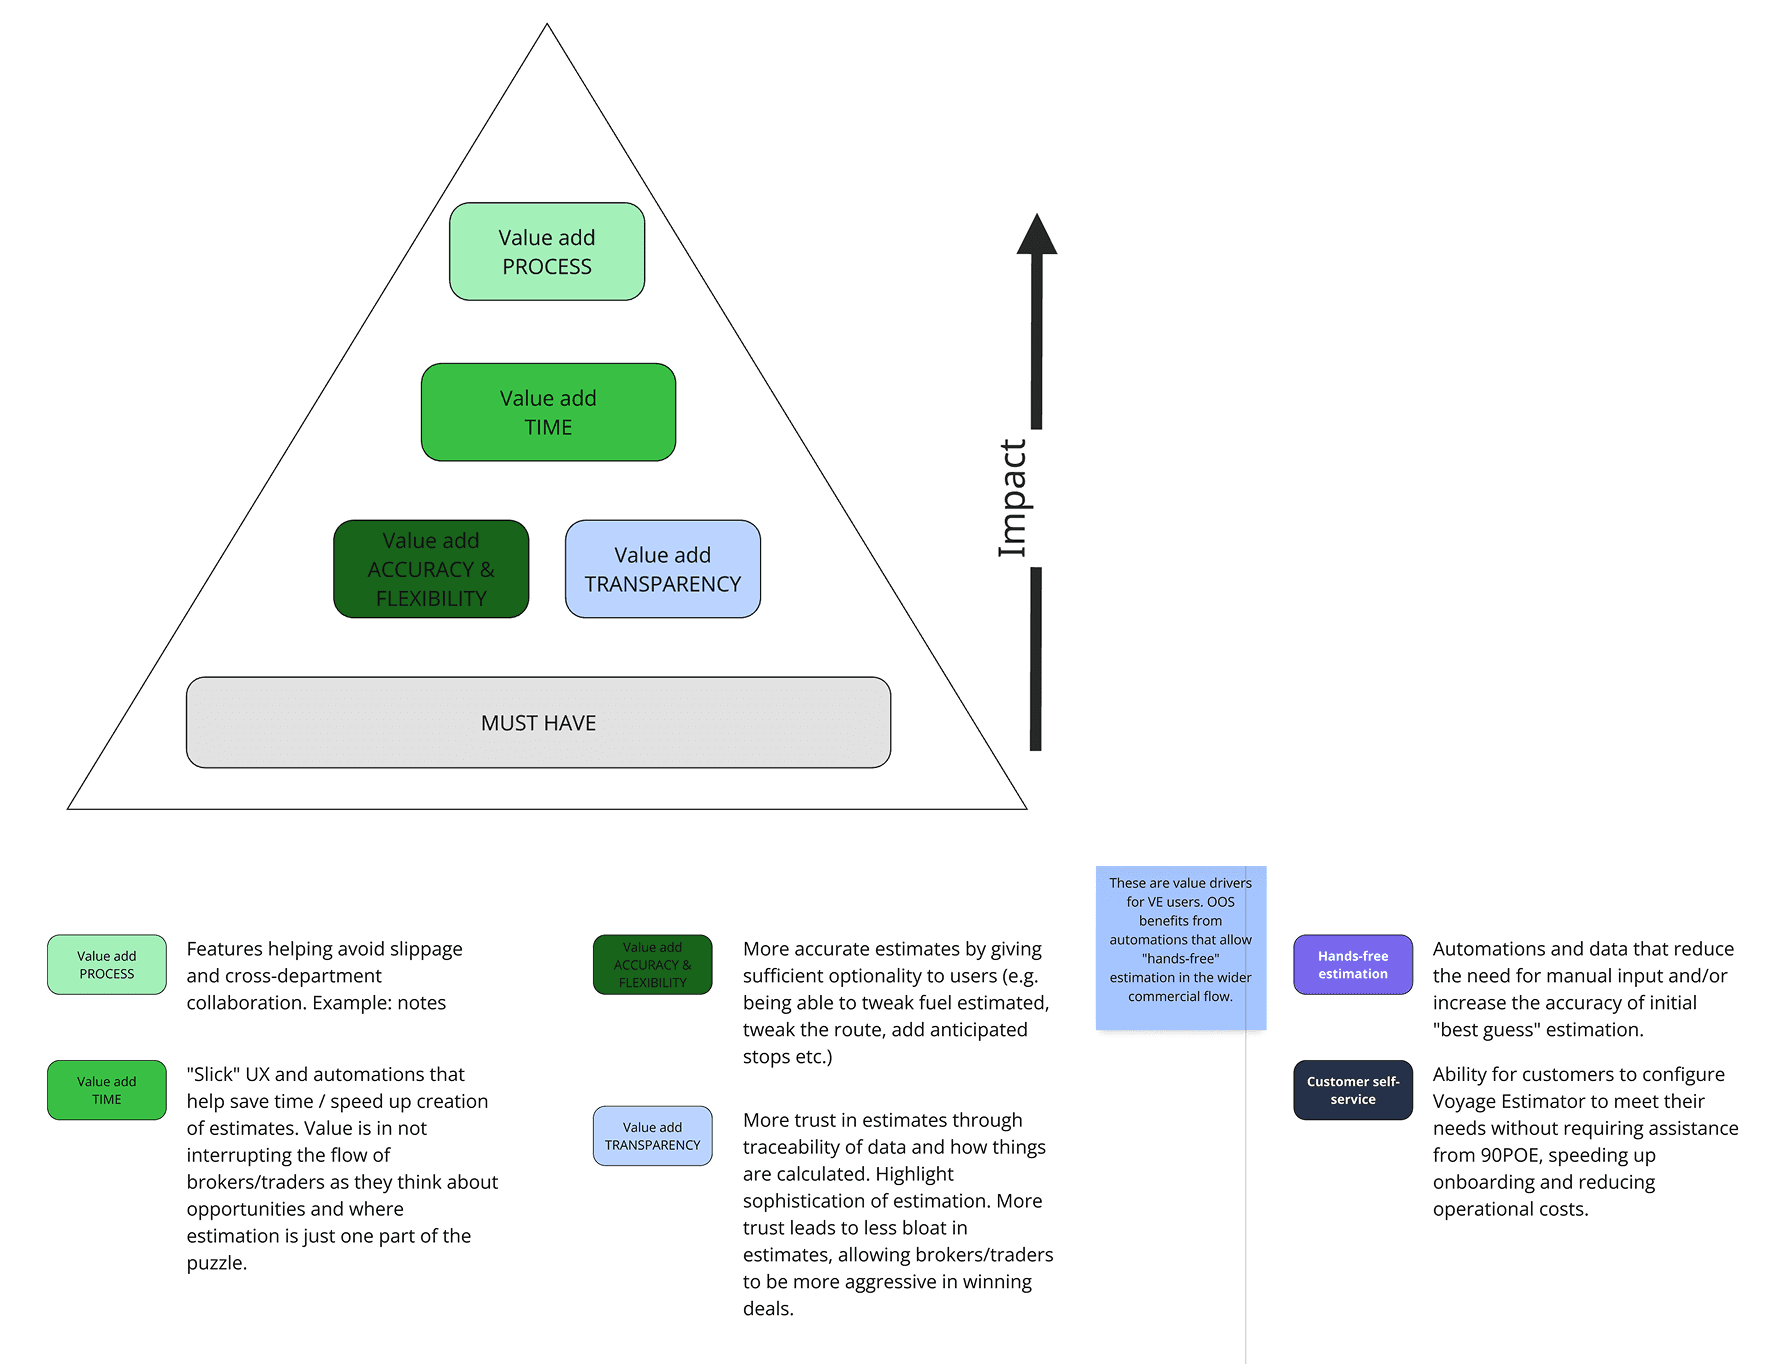
User segmentation and behavioral insights directly informed our design strategy. Operators were divided based on contract and vessel type, revealing distinct workflows and data priorities. These findings enabled targeted UI customization, where the interface adapted dynamically to each persona’s operational needs. Mapping value against process complexity helped align design impact with business goals—ensuring that high-value, high-friction tasks were prioritized in both functionality and UX clarit
Operators were divided into
Voyage Charter & Time Charter users, depending on contract type.
Vessel-Specific Operators (e.g., tankers, wet cargo, etc.), each requiring different key data points.
Customization
UI adapted dynamically based on the persona’s contract type and vessel responsibility.
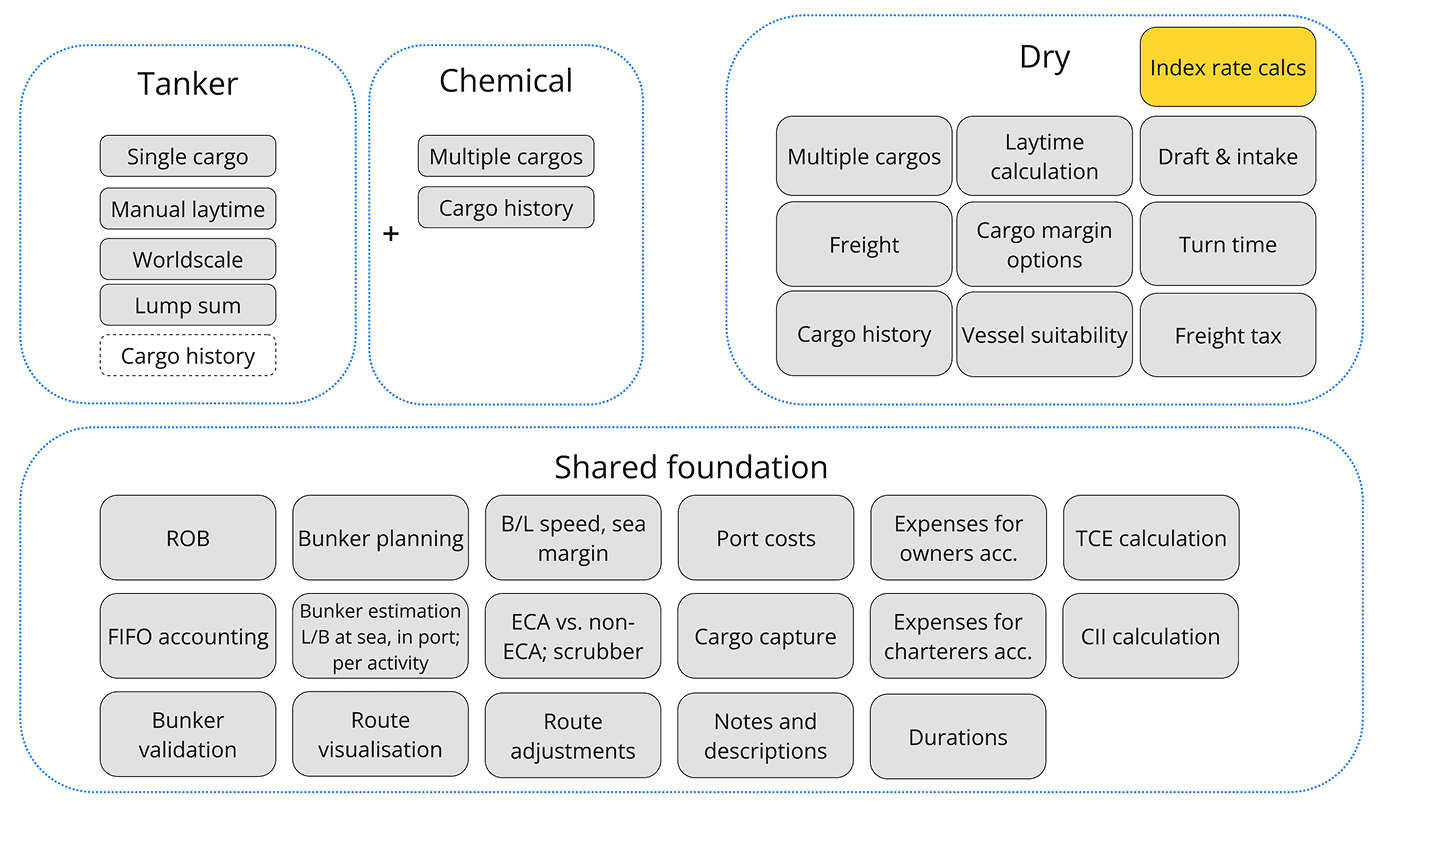
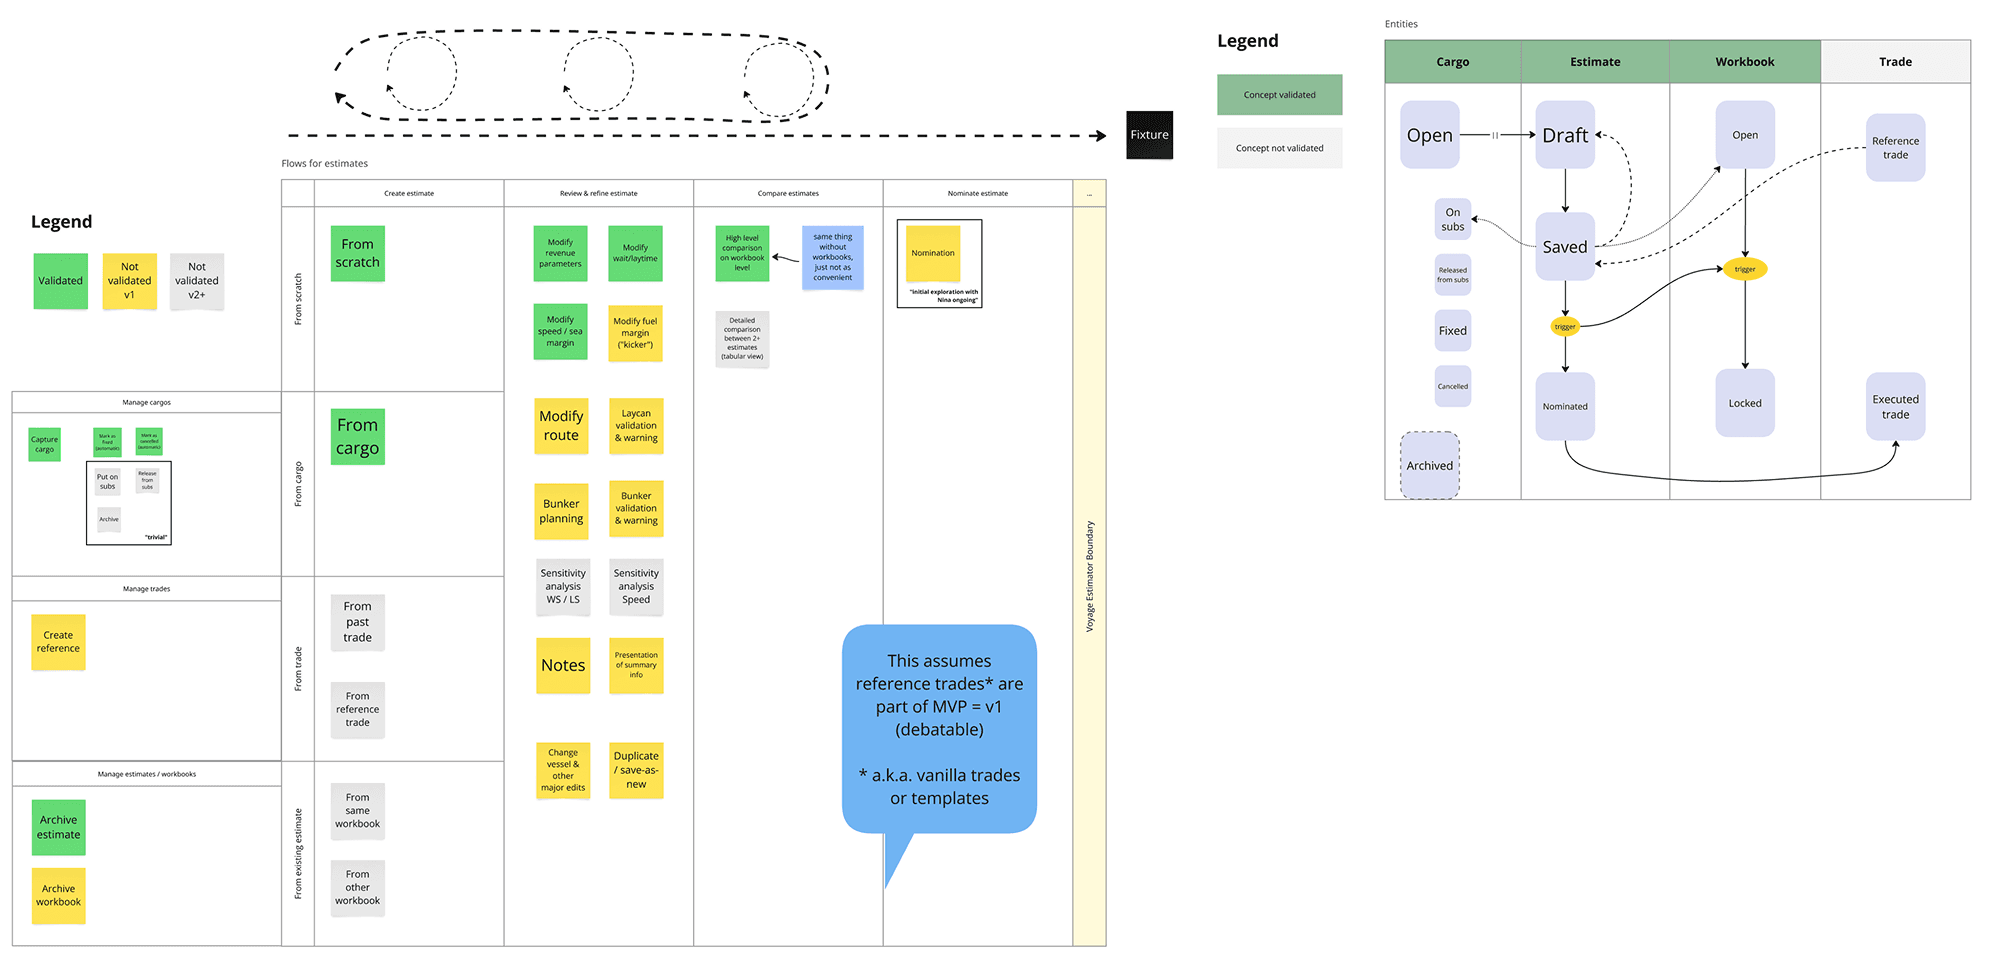
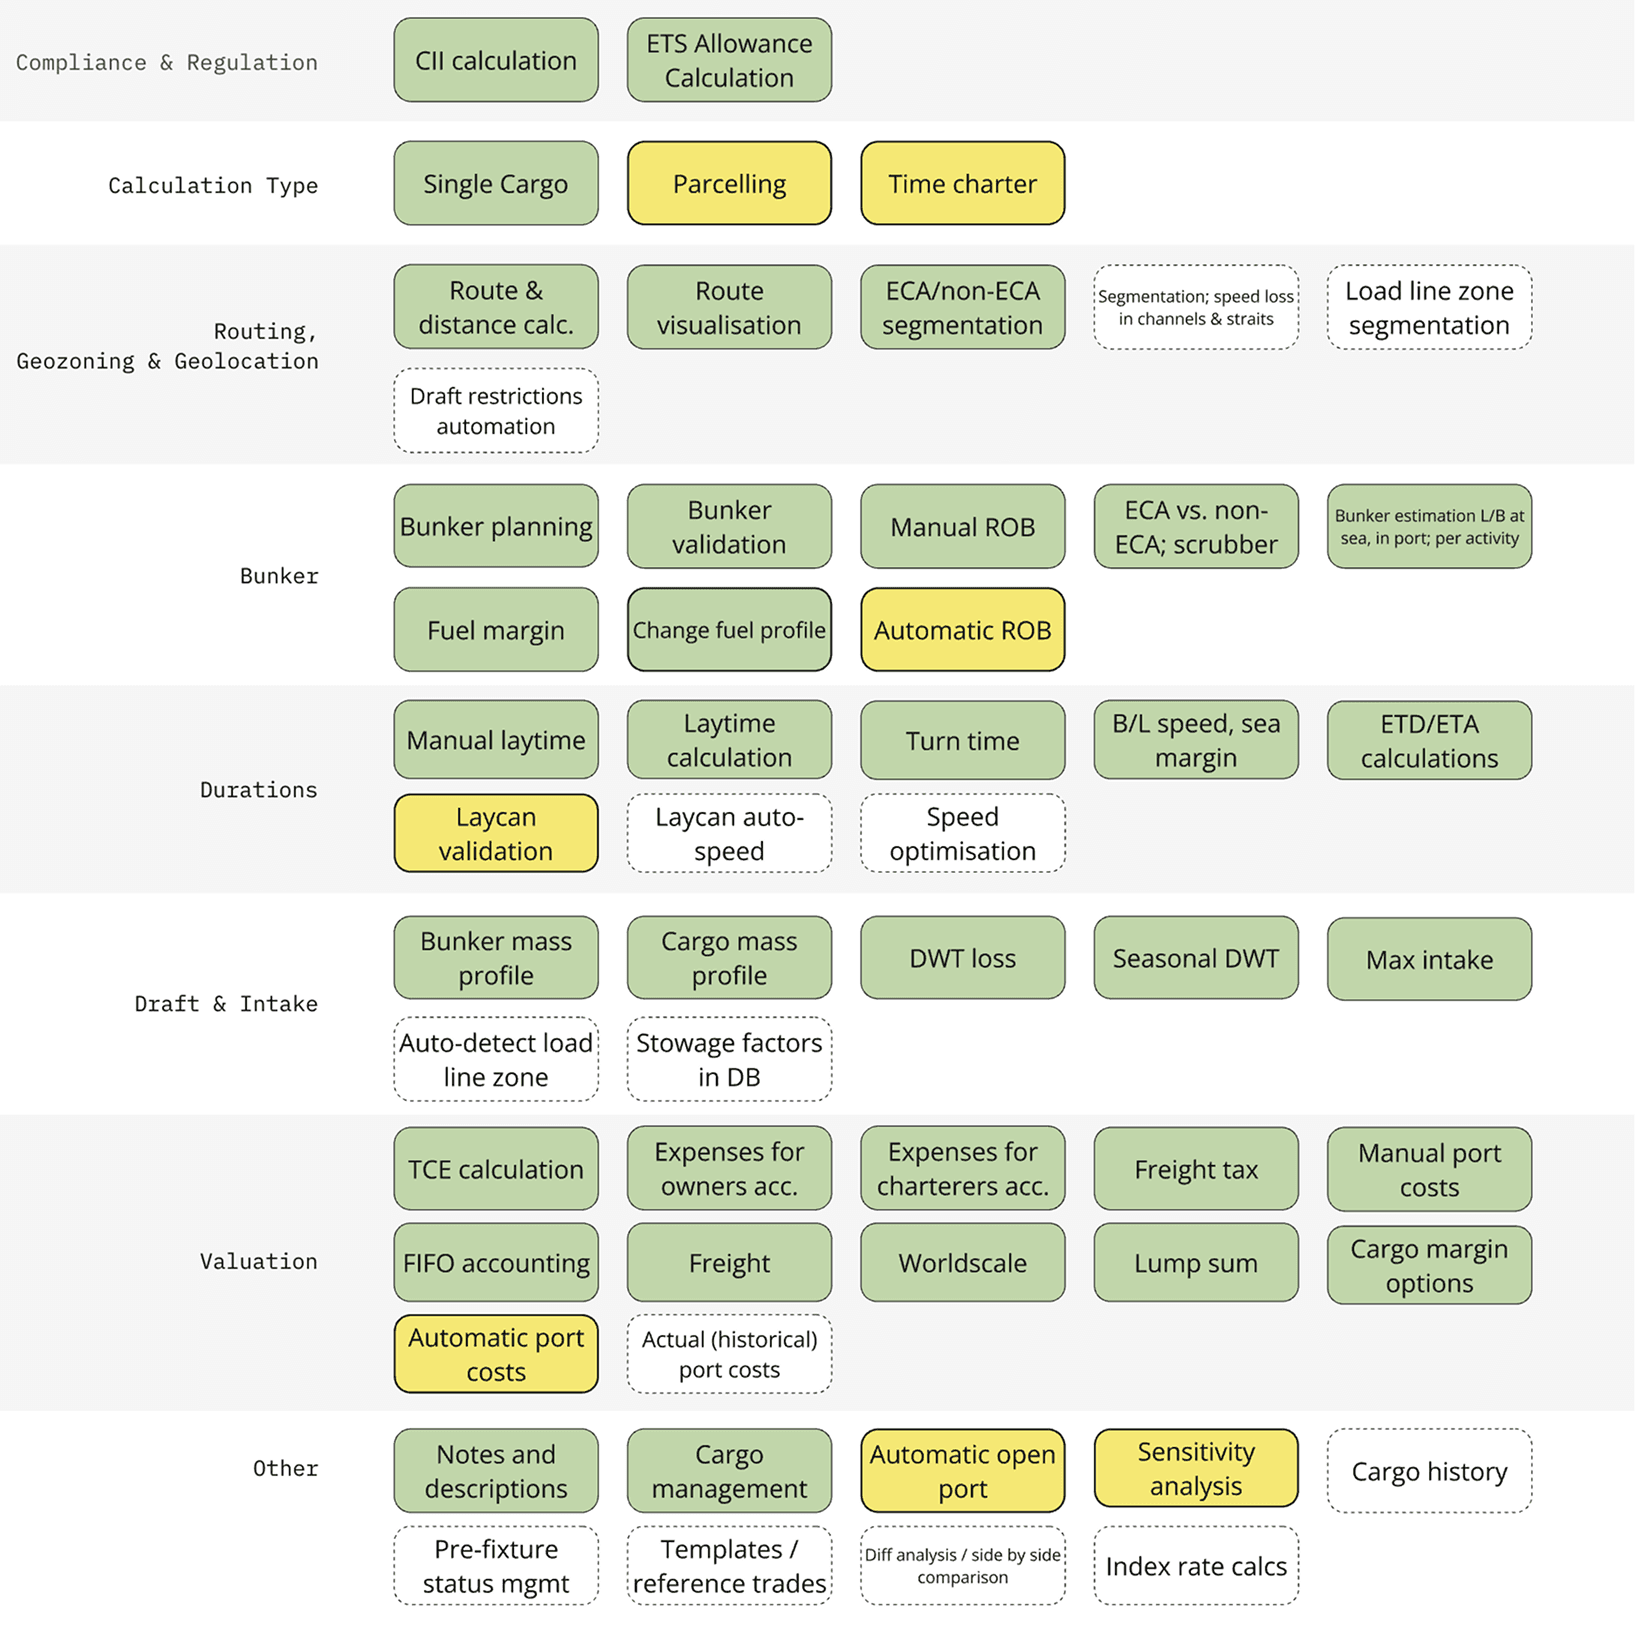
Wireframing & Information Architecture
We began with low-fidelity wireframes to map missing functionalities, clarify user flows, and test navigation logic early. Collaboration with PMs and the Head of Product ensured alignment on business goals and system constraints. The focus was on surfacing critical voyage KPIs in context, demonstrating how operational changes directly influence business outcomes. The resulting IA simplified complex workflows while maintaining scalability across contract types and vessel responsibilities.
1. Initial Wireframes
Drafted to map out missing functionalities and refine navigation.
2. Collaboration with PMs & Head of Product
Defined business objectives and scalable solutions.
3. Goal
Present essential KPIs in an intuitive way, demonstrating how changes in voyage execution impact key business metrics.

Key UX Decisions & Solutions
Following wireframe testing and synthesis of user insights, we translated findings into concrete UX decisions. Each solution directly addressed usability challenges uncovered during research, balancing simplicity, visibility, and interaction flow. These changes were instrumental in driving clarity, efficiency, and user trust across the platform.
1
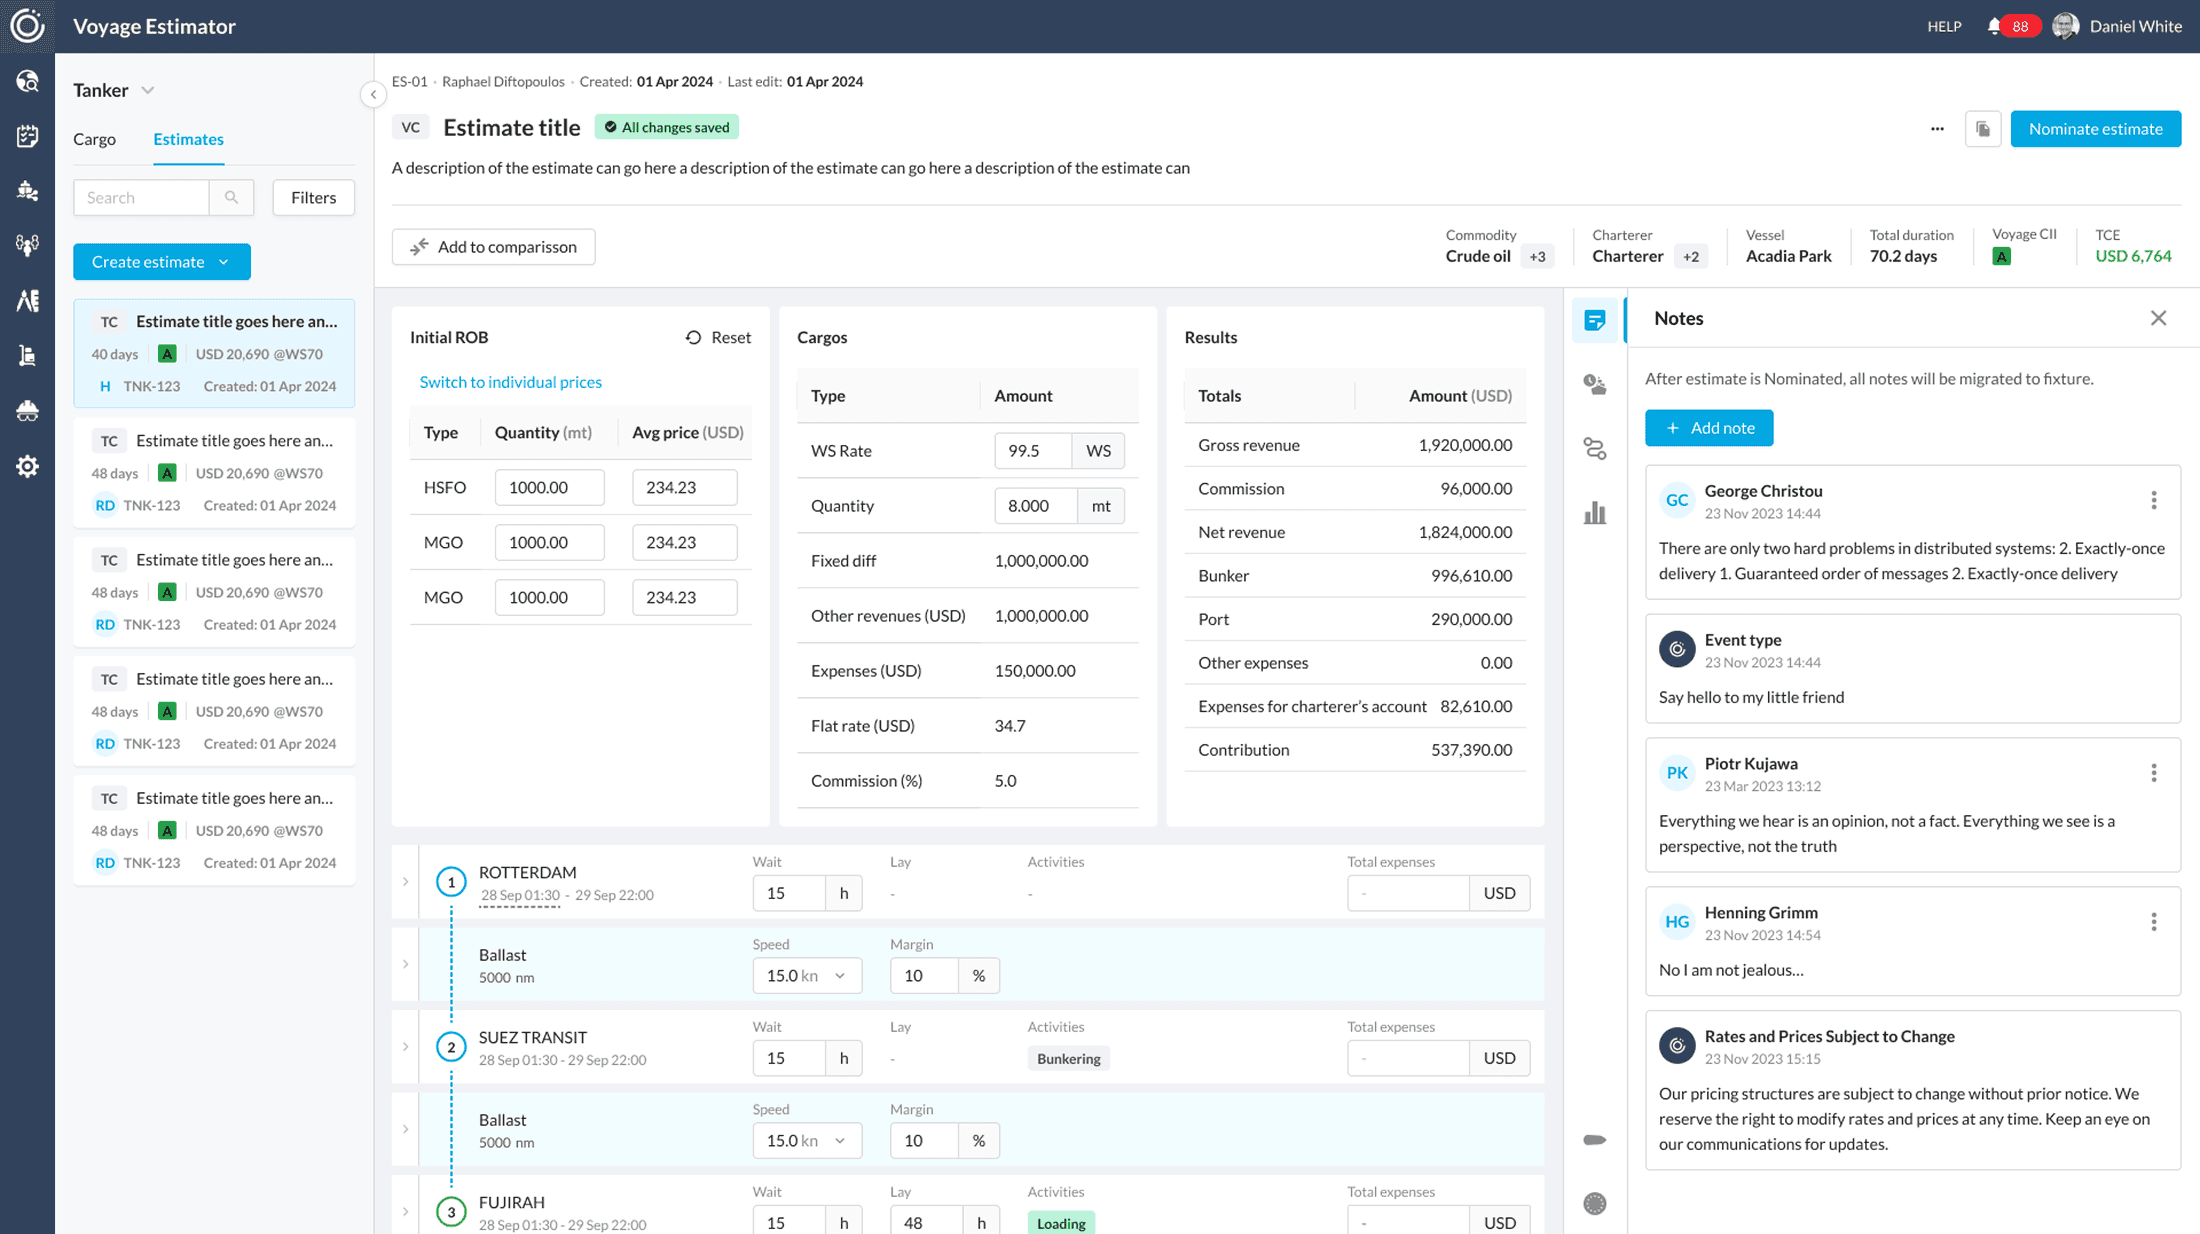
Collapsible Sidebar for Advanced tools
Allowed users to refine voyage details and view additional metrics without cluttering the main interface.
2
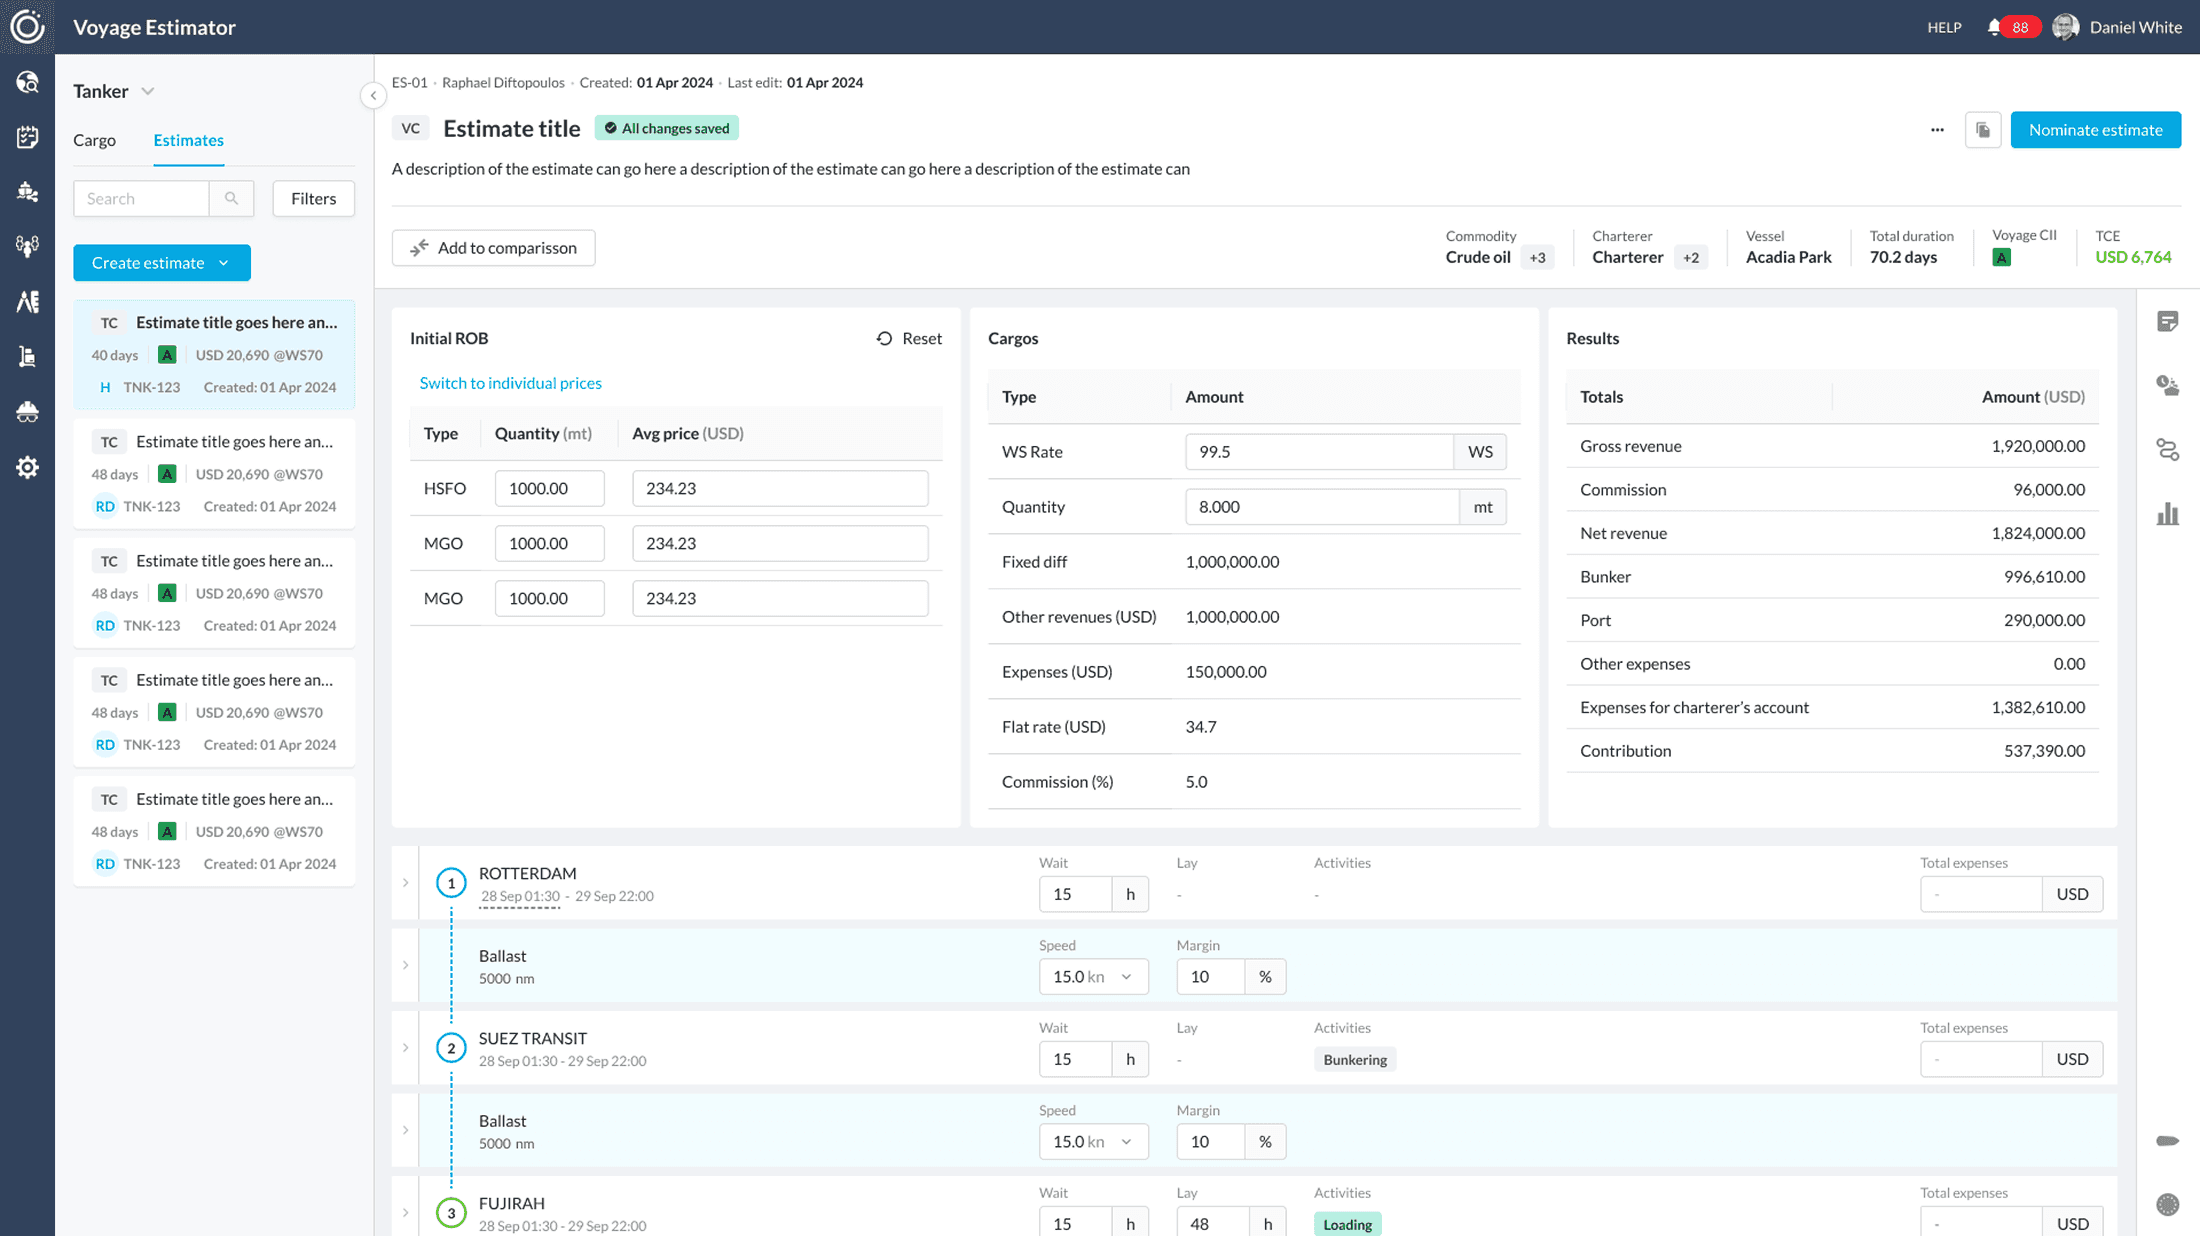
Essential KPIs on the Main Screen
Displayed only the most relevant KPIs needed for quick decision-making, while additional detailed information was accessible in an expandable right-side toolbar. This ensured users could focus on key insights without being overwhelmed by data overload.
3
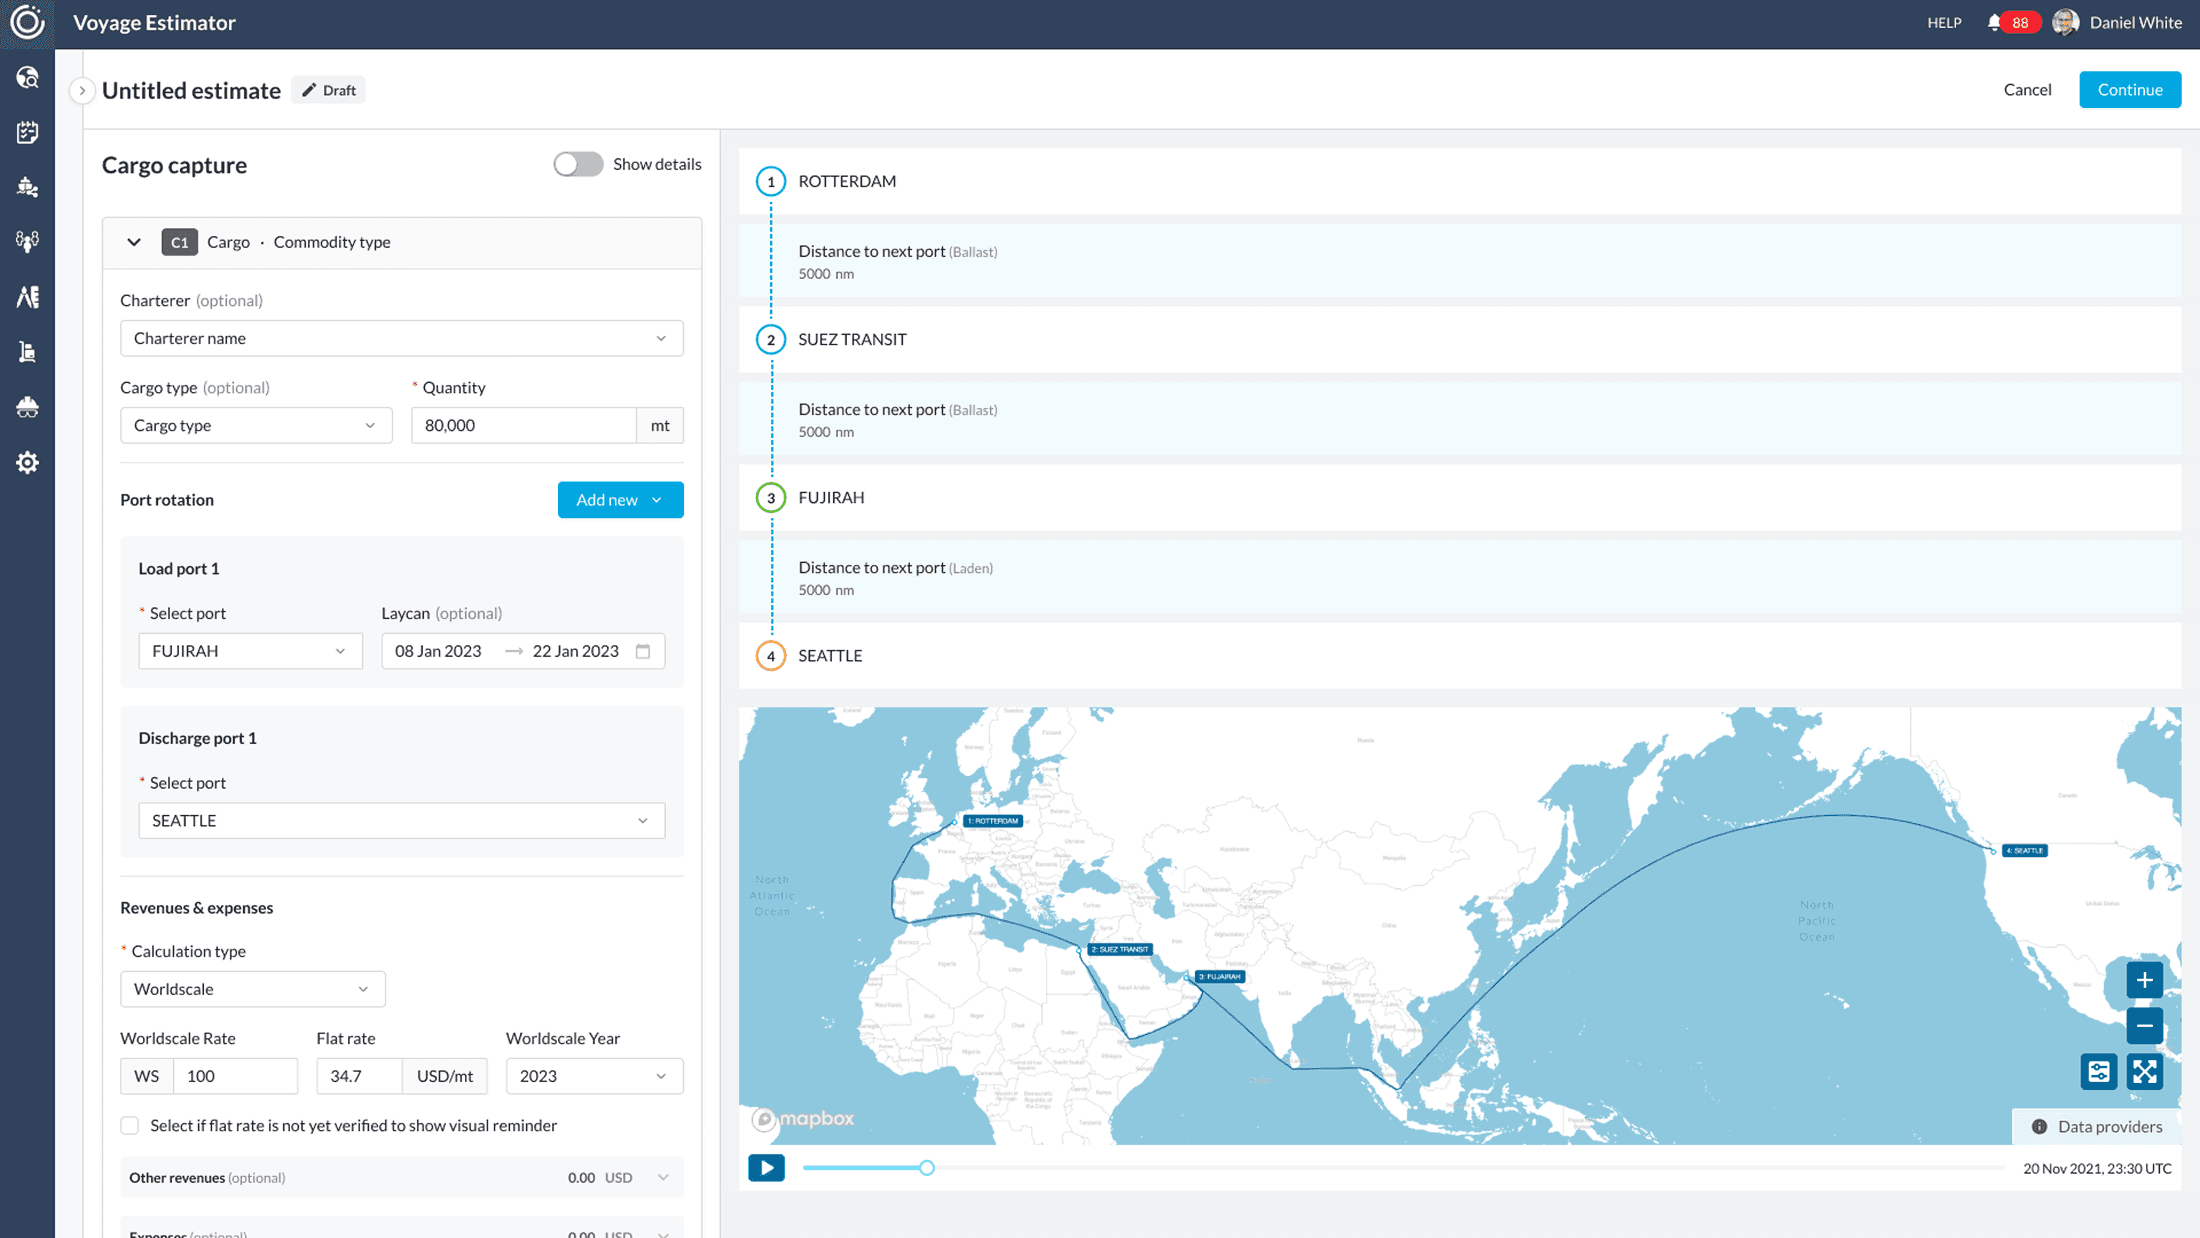
Step-by-Step Input Forms
Replaced large input lists with guided, actionable steps to reduce cognitive load and improve accuracy.
Final mockups

Outcomes & Metrics
The redesign was met with strong adoption and positive user feedback, reinforcing the platform’s value and positioning it as a unified maritime solution. Stakeholder input highlighted improved visibility, usability, and decision-making confidence.
1
400%
increase in adoption after the UX overhaul.
2
200%
Growth in page views, indicating higher engagement.
3
Less use of 3rd party tools
Users relied less on third-party tools, reinforcing 90POE as an all-in-one maritime platform.
“ We found that the dynamic Voyage Estimator capability, which we’ve very much constructed with 90POE, allows us the visibility to assess which options we’re going to trade into—not only on a vessel basis but very much on a book basis. We can see all the different ships within the different classes and assess what we consider to be the best option and the best decision. ”
– Angus Douglas, Director of Chartering, Zodiac Maritime

